Introduction
Using data from the Healthy People 2020 website, in the first section, this paper discusses the commonalities among the countries that have the longest life expectancies. The second section, it discusses why the United States ranks quite low on the catalog of life expectancy.
Commonalities among the Countries that have the Longest Life Expectancies
Life expectancy refers to the number of years an individual in a certain age is expected to live given that the transience rate does not change in the future. Males and females have different life expectancies. Therefore, Healthy People 2020 listing presents separate and combined figures under this category. In the global platform, based on the 2010 to 2013 data that was derived from the United Nations’ world population, the life expectancy for males was 68.5 years while females were expected to live for 73.5 years at birth (WHO, 2015). Indeed, the World Health Organization asserts that women have longer life expectations in all nations with an exception of Tonga (WHO, 2015). While discussing commonalities in life expectancies for countries that have the longest life expectancies, it is important to note that a comparison of life expectancies at birth for different nations is problematic because of the varying meanings of stillbirths and live births (WHO, 2015).
The United States ranked low in population expectancy compared to other OECD nations. The Healthy People 2020 website indicates that in 2007, the US “ranked 27th and 26th out of 33 countries within its peer group of Organization for Economic Co-operation and Development (OECD) countries, for life expectancy at birth for females and males, respectively” (Healthy People 2020, 2016, Para.3). Nations that have high life expectancies also have highly effective programs for dealing with health risk factors, including persistent diseases, sexually transmitted illnesses such as HIV and AIDS, the problem of homelessness, and accessibility to quality healthcare services. The socio-economic status of the populations that live in such nations is also high. Indeed, these commonalities are major for the nations that are ahead of the US in terms of life expectancies at birth listing as referred to by Healthy People 2020.
Nations that are ahead of the US in terms of the life expectancy listing are mainly located in Europe. They spend large sums of money addressing health risk factors. Why do nations with high life expectancies spend more on health care services and programs for poverty alleviation? Scholarly evidence shows that financial hardships and poverty are associated with poor health. With regard to the Department for Communities and Local Government (2012), poor health can also cause poverty and hence homelessness. For instance, poor health can have an impact on an individual’s ability to engage in productive employment or education, which is an important aspect for alleviating poverty. Poor health can also cause people to sacrifice necessities, including housing, to meet various medical care and treatment costs.
Adequate statistical analysis has provided a practical demonstration that one of the key determinants of public health, namely people’s life expectancy, is dependent on poverty alleviation and expenditures on health care strategies (Raoult, Foucault, & Brouqui, 2011). One of the major issues in public health discourses is the development of policies that can guarantee a rise in the life expectancy of people within a particular nation. Compared to nations that are ahead of US’ life expectancy, the nation also spends large sums of resources in mitigating potential health risks for its population. Therefore, a question emerges, ‘why does America rank so low in terms of its life expectancy at birth?
Why the United States ranks Low on the life expectancy List
Similar to the commonalties of nations that appear to top the list of life expectancy, the United States spends large sums of money on health care. In the 1970s, US citizens had higher life expectancies than many of these nations. Why is the US performing poorly in comparison with other OECD nations, even with the increased spending on health care? Indeed, the life expectancy of the US is lower by more than the international average by one year. This figure is lower than that of Germany and Canada. However, this finding does not imply that one anticipates living lesser years in the current US compared to the 1970s America. Rather, the Healthy People 2020 data implies that the life expectancy of the US has grown at a lower pace compared to the other 25 nations that are ahead of it.
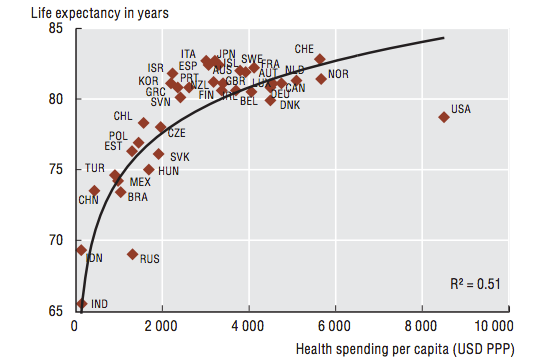
OECD (2013) explains why the US lags behind in the listing of life expectancy at birth compared to other wealthy nations. The nation spends large sums of money on evidence-based health care technologies such as MRI and CAT scans. In 2010, President Obama signed into law the ‘Patient Protection and Affordable Care Act’, alternatively referred as the Healthcare Reform Act, or ObamaCare. Among many concerns of the Act, the goal of the health care reform is to avail a health care insurance that is affordable by all citizens of the United States while at the same time reducing the escalation of healthcare spending (Flaer, Mustafa, Alotaibi, & Maha, 2012). Nevertheless, the US spending on health care is still high compared to other wealthy nations that have high life expectancies as shown in graph 1. Lower life expectancy suggests that the US gains many health outcomes from its spending in health care compared to other wealthy nations.
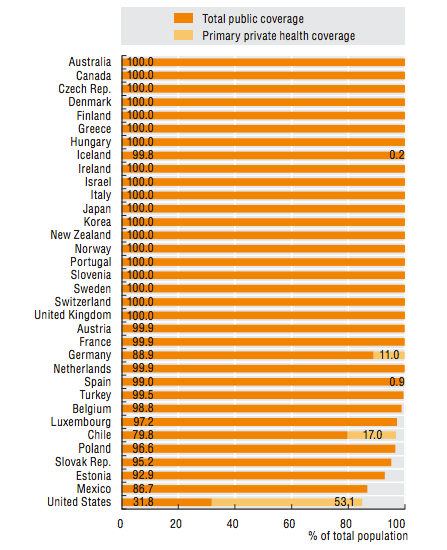
In addition to the ObamaCare, the US also has other health insurance plans such as Medicaid and Medicare. Any government earns from its citizens. When funding these plans, the American citizens carry the weight either directly or indirectly. For example, ObamaCare is meant to ensure that all Americans have access to reasonably priced health services. Despite the high expenditure on these health insurances, graph 2 below shows that Americans remain highly uninsured among the OECD nations that lead in life expectancy at birth.
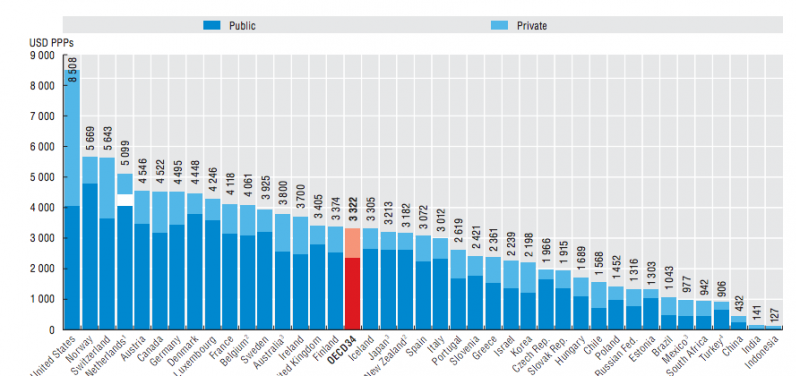
Even if new taxes to fund the plan such as ObamaCare are not directly reflected in the US tax tables, the cost is still enormous to the citizens. President Obama’s administration promises that the plan will not affect the families, which make less than $250, 000 annually. However, the ObamaCare plan is a reflection of high expenditure in health care, as it is approximated to cost the United States $503 billion from 2010 to 2019. Nonetheless, this figure does not translate into higher life expectancy while compared to other OECD nations. As shown in graph 3, the US is good at spending in health care similar to other OECD nations whose such spending translates into higher life expectancy.
Theoretical reasoning suggests that high spending in healthcare insurance and high investments in medical technologies translate into higher life expectancies. Nevertheless, this claim is not the case. For example, the technologies of scanning coupled with screening are highly embraced in the US for the case of cervical cancer as shown in graph 4. However, Americans fail to value regular visits to their doctors. OECD (2013) supports this assertion by claiming that the average US citizens visit their doctors four times annually while compared to international average of six times.
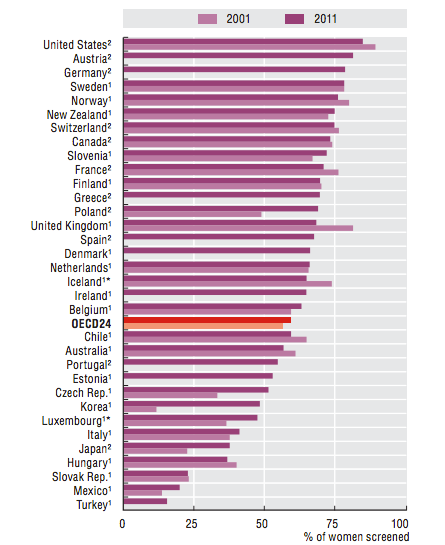
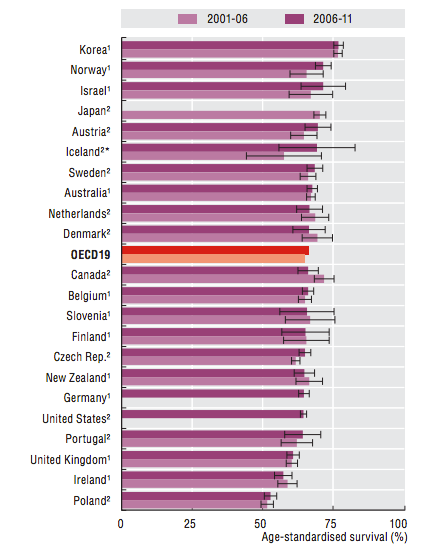
Although the US is among the top in cancer screening, it has a below-average survival rate of the same disease as shown in graph 5.
Despite the US having a low survival rate for cervical cancer, this finding is not always the case for other diseases. For example, the nation does well above average in screening followed by the survival rate for breast cancer. However, from the above discussions and OECD (2013) report, the American health systems invest heavily in scanning and screening, despite the observation that the US people make limited trips to their doctors. This situation suggests that Americans score greatly in identifying health problems, although they are slow in following the treatment process.
Conclusion
The leading wealthy nations in life expectancy levels at birth spend huge sums of money on healthcare insurance and programs for promoting good public health and treatment. The US is one of wealthy nations, which prioritize healthcare spending. However, such spending does not directly translate into high life expectancy compared to other OECD nations as evidenced by its ranking in the 26th the position by Healthy People 2020. From the discussions of the paper, this situation may be explained by factors such as fragmentation of the care system, relatively lower resources that are channeled to the promotion of public health coupled with primary care when compared to other wealthy nations, and the high-uninsured population size.
Reference List
Department for Communities and Local Government. (2012). Rough sleeping statistics England – Autumn 2011 experimental statistics. London: Department for Communities and Local Government.
Flaer, P., Mustafa, Y., Alotaibi, M., & Maha, H. (2012). Thinking Through Healthcare Reform. Ageing International, 37(2), 181-185.
Healthy People 2020. (2016). General Health Status. Web.
OECD. (2013). OECD Health Statistics 2013. Web.
Raoult, D., Foucault, C., & Brouqui, P. (2011). Infections in the homeless. Lancet, 7(3), 77-84.
WHO. (2015). World Health Statistics: Global Health Observatory Data Repository: Life Expectancy-Data by Country. Geneva, Switzerland: WHO.
