The study “Emergency Medical Care of Incarcerated Patients” by Martin et al. (2020) is a quantitative one since the authors used an observational cohort method. Generally, cohort studies are quantitative because of the methodology; moreover, this is a retrospective study, meaning that those authors have used data that was previously collected, for example, the number of incarcerated individuals with chronic conditions or mental health diseases, which can be found in records of the incarceration facilities. A qualitative study would require direct participation of the cohort; for example, the researchers would need to collect data through interviews. Hence, I came to the conclusion that this study is qualitative by examining the research methodology and the results. The authors use statistics and calculations when examining data, as opposed to analyzing texts or interviews, which points to the fact that this study is quantitative in nature.
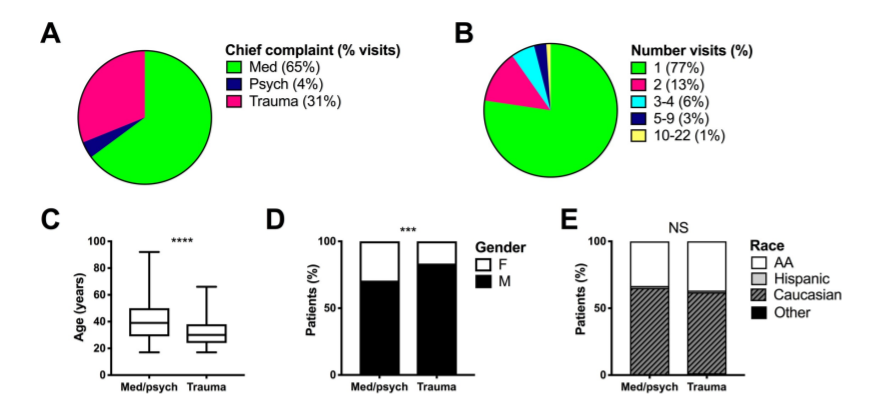
The graph selected for this lab is a pie chart that, displayed as Figure 1 under letters A and C. A pie chart is a type of graph that shows the distribution in a circle. The circle itself accounts for 100% of data, and the different sections and colors show the percentage accounting for a specific characteristic. In this case, pie chart A shows the distribution of complaints among the population of the prisoners, and the majority of them are linked to a medical issue that is shown in green. Pie charts are helpful when there is a need to illustrate the proportion of some statistical data.
The article aims to determine the most common health-related problems that the population of incarcerated individuals faces in the United States. Since almost 6% of the population in this state are incarcerated, and this condition limits their access to medical services, the authors want to determine which issues are the most common. Hence, the collected cohort data, which means that they followed the same study sample for a time period and collected statistical data based on the variables the authors analyzed. In the case of pie charts in Figure 1, the data shows the main complaints that the prisoners have and the number of visits to a medical facility they had. The class size is shown as the percentage of visits, and the class width is 0,61 based on the number of complaints linked to a medical and psychiatric condition. Explanatory variables are the main complaints of the incarcerated individuals, while response variables are the percentage of one of the three chief complaints in comparison to all cases. In the case of a pie chart, the shape of the distribution is displayed through the slices relating to each of the percentages. Class consistency is maintained since all data is obtained for one cohort.
The data representation shows that the majority of complaints are medical. However, most incarcerated individuals do not have more than one visit to a care facility, indicating that there might be a problem with healthcare service provision in prisons.
One alternative way of representing this data is a table, the benefit of which is the ability to include more statistical data, such as the total number of cases observed. However, the downside of this method is the lack of a visual representation, which helps people perceive information more easily. Another alternative is a histogram, which is easy to create an illustration of a frequency distribution. However, the shape of histograms, when compared to pie charts, makes it difficult to compare two at the same time, which is the main con of this method. Those graphs were not used in this article because they are not suitable for the comparison of two data sets.
Reference
Martin, R., Couture, R., Tasker, N., Carter, C., Copeland, D., Kibler, M., & Whittle, J. (2020). Emergency medical care of incarcerated patients: Opportunities for improvement and cost savings. PLOS ONE, 15(4), e0232243.
