Introduction
Here, an analysis of the data collected for a Capstone project, which is dedicated to reducing catheter-associated urinary tract infections (CAUTIs), will be presented. The project involves investigating the effectiveness of 2% chlorhexidine washcloths in preventing CAUTIs, and it uses a pre-test post-test design. The site’s nursing team was provided with the training necessary to prevent CAUTI and apply the washcloths correctly. The project is in progress, which is why the post-test data for the patients and CAUTIs cannot be provided yet. However, the data that describe the staff’s demographics and pre-and post-training scores can already be obtained. Here, descriptive and inferential statistics will be used to analyze the data and make conclusions about the sample and training.
Data Preparation
The demographic data of the participants, as well as their pre-and post-training CAUTI prevention scores, have already been collected. The project used a Likert-scale tool (Appendix A). The scores were computed based on the number of correct answers before and after the training; together with the demographic data, all the information was placed into an Excel datasheet. To prepare the data for the analysis, all the entries were manually checked to ensure the absence of mistakes and impossible codes; manual checking is a typical solution to this task (Polit & Beck, 2017). The scores were transferred to an SPSS file as well.
Data Analysis
Demographic Data Analysis
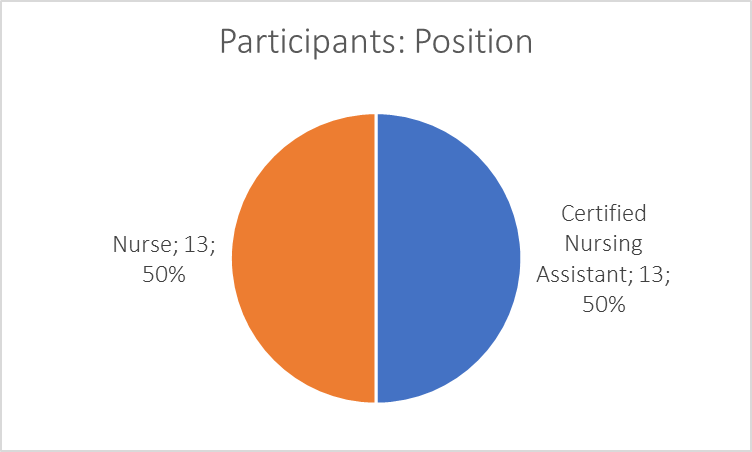
The demographic data need to be reported to describe the sample. Percentages and graphs were employed to represent the information in detail and visually. Microsoft Excel was used for creating the figures. As can be seen from Figure 1, 26 people were recruited; 100% of them were female. Exactly 50% of the sample consisted of nurses; the rest were nursing assistants (see Figure 1).
Most participants were older than 30 (see Figure 2). Only six people (approximately 23% of the sample) were younger; nine of the participants (33%) were aged between 31 and 40, and six more people (roughly 22%) reported being between 41 and 50 years old. Also, five people were older than 51 but younger than 60, and one participant was older than that.
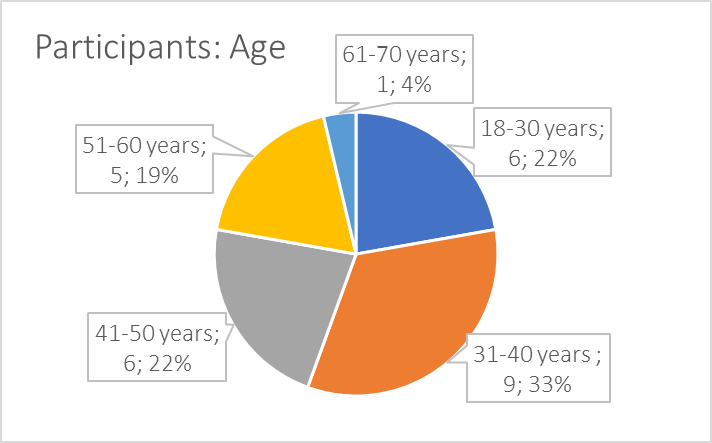
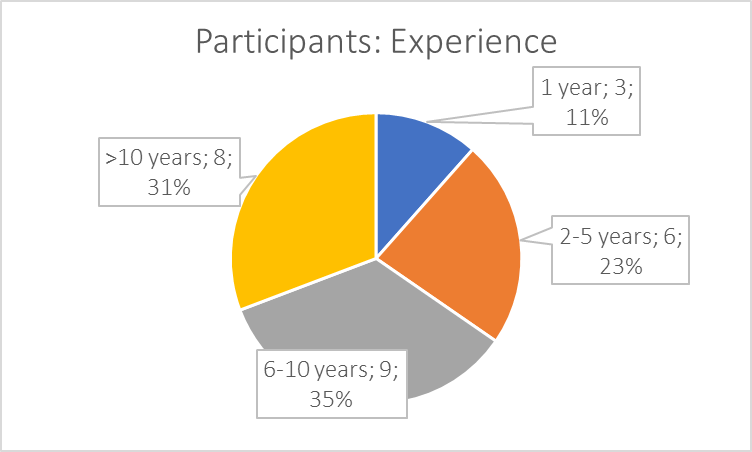
Figure 3 demonstrates that most participants had six years of experience or more; only three of them (a little over 11%) reported having the working experience of one year, and six of them (around 23%) had been working for two-to-five years. Nine people (roughly 35%) had worked for more than six years but less than ten years and the rest of the participants (31%) had experience of over ten years of work. To summarize, the sample included female nurses and nursing assistants, and the majority of them were older than 30 and rather experienced.
Statistical Analysis: Testing for Relationships
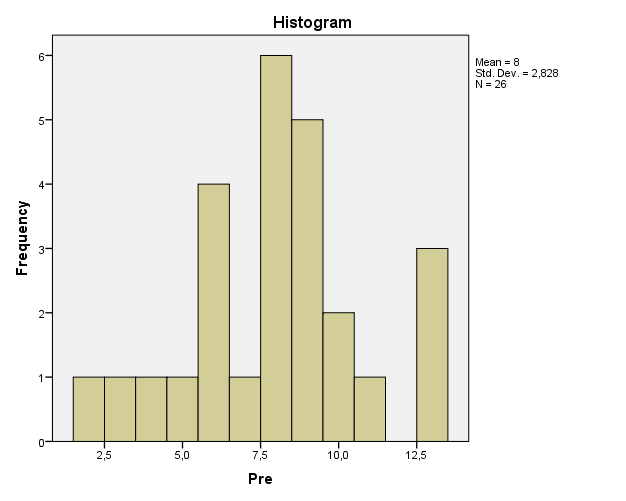
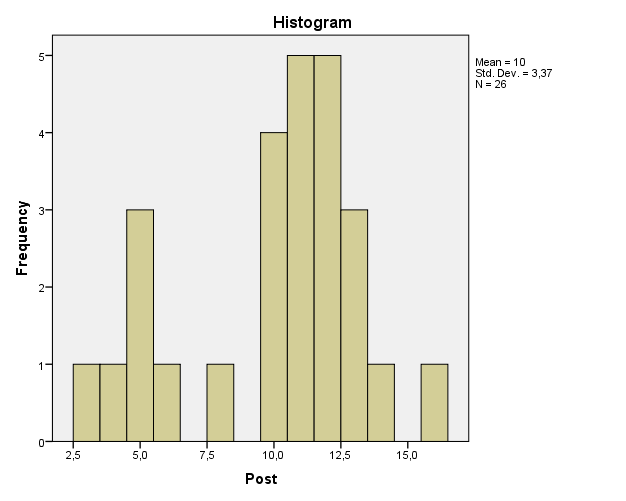
The goal of this analysis is to determine if any relationship between the independent (intervention) and dependent (survey score) variables can be found. The project used only one group, and the final scores of the participants are represented through continuous data, which means that the paired t-test should theoretically be applicable (Polit & Beck, 2017; Richardson-Tench, Nicholson, Taylor, & Kermode, 2018). However, a t-test can only be used if several assumptions can be made, and that includes the assumption of normal distribution (Polit & Beck, 2017). The score’s histograms, which can be found in Figures 1 and 2, show that the scores are not normally distributed. In other words, the t-test cannot be applied to these data; instead, as indicated by Polit and Beck (2017), it is necessary to use the Wilcoxon signed ranks test.
Inferential test: The program SPSS Statistics was employed for inferential testing in this project. Table 1 details the results of the Wilcoxon signed ranks test with a confidence interval of 95%. The significance is below the initially established level of 0.05 (p=0.04), which means that a statistically significant difference has been proven to exist between the two samples (Polit & Beck, 2017; Richardson-Tench et al., 2018). Consequently, it can be assumed that the tested intervention had an impact on the participants’ scores, which measure the team’s ability to prevent CAUTI and apply the 2% chlorhexidine washcloths. Therefore, the statistical analysis indicates that after their training, the participants became better qualified to take care of patients and utilize the washcloths.
Table 1: Wilcoxon Signed Ranks Test for the CAUTI Nurse Survey Results
Conclusion
Currently, only the data regarding the participants’ demographics and CAUTI prevention scores can be obtained. The analysis demonstrates that out of the 26 participants (13 nurses and 13 certified nursing assistants), all were female; most of them were also relatively experienced and over the age of 30. Their CAUTI prevention scores required the application of the Wilcoxon signed ranks test. According to the results, the training was successful in enhancing the participants’ ability to prevent CAUTI. Thus, the appropriate application of descriptive and inferential statistics allowed summarizing the data and using the results to make inferences about the intervention and its impact on the participants’ performance.
References
Polit, D.F., & Beck, C.T. (2017). Nursing research: Generating and assessing evidence for nursing practice (10th ed.). Philadelphia, PA: Lippincott, Williams & Wilkins.
Richardson-Tench, M., Nicholson, P., Taylor, B., & Kermode, S. (2018). Research in nursing, midwifery and allied health: Evidence for best practice (6th ed.). New York, NY: Cengage AU.

