
Introduction
Breast cancer is one of the most common forms of cancer affecting women worldwide, having a significant impact on both individual patients and public health. Research into this disease is fundamental, given the current statistics of more than 600 thousand deaths worldwide each year, while more than 2.3 million are currently suffering from this disease, according to 2022 WHO statistics (World Health Organization, 2024). Survival analysis provides data on time to critical events such as disease progression, relapse, or mortality, which can help practitioners refine their treatment strategies, identify prognostic factors, and improve patient care.
The Kaplan-Meier test proposed in this paper provides information on the probability of patient survival over 5 years. It tests the null hypothesis that 50% of participants will have a risk of dying from breast cancer within five years. In addition, this work proposes an age-group assessment to understand disease dynamics in this demographic better.
Discussion
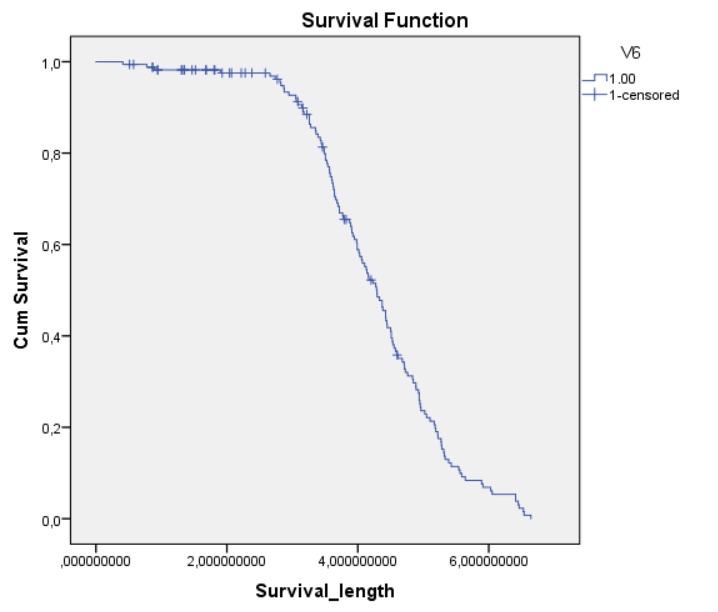
This analysis was carried out using the SPSS software package. Figure 1 shows the survival chart for the breast cancer dataset sample without ranking by age. According to it, it is impossible to accept the alternative hypothesis that within five years, the risk of death does not arise for 50% of participants, since the graph at the 5-year level reaches values of just over 0.2, or just over 20%, while the level of the 50% mark is around 4+ years.
In addition, the patients’ ages were known in this study. As a result, an appropriate decade-based age division was undertaken: 20-29, 30-39, 40-49, 50-59, and 60+, since the sample comprised patients aged 26-68 years. Figure 2, also obtained using SPSS, enables assessment of disease-course dynamics across these selected groups.
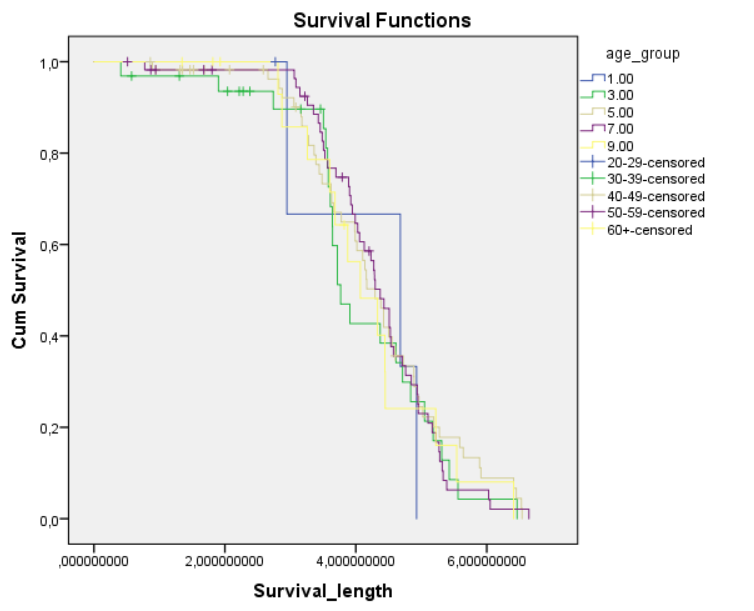
Although the survival rates of some age groups have come closer to the rate predicted by the hypothesis, none have reached it. The youngest group of patients, 20-29 years old, is the nearest, but it is represented in the sample by only four cases; the proportion is too small to draw a balanced conclusion about the duration of the mortality risk. Representatives of groups aged 40 to 60 or more are approximately at the same level relative to 50% of the sample’s survival rate, while the group of 30-39-year-old patients in the sample is at the highest risk. Only a small proportion of respondents met the hypothesis’s five-year threshold: 32 patients out of a total sample of 168 survived to five years after this diagnosis.
In addition to this method, a wide variety of approaches are used in scientific research on this disease. The most relevant are Cox regression and the adaptation of machine learning tools to predict five-year survival. For example, a group of scientists applied machine learning to analyze 31 studies and evaluate the accuracy of predictive models, yielding results ranging from 0.51 to 0.97, a slight improvement over previous studies, despite many limitations (Li et al., 2021). Moncada-Torres et al., using machine learning, improved the accuracy of the Cox proportional hazards regression method, as measured by the c-index, by only 0.1, from 0.63 to 0.73 (2021). However, in both studies, a systematic review of similar studies showed only a few cases of 5-year survival or longer; as a rule, this indicator was lower, as confirmed in this experiment.
Otherwise, this line of research focuses either on specific demographic groups or on evaluating new approaches to chemotherapy. Reported statistics in the previously mentioned works indicate that, first of all, effective treatments are required, not just aural estimates, which translates into long-term examination of genetics and hormones (Győrffy, 2021; Yau et al., 2021). Moreover, the age of patients is assessed in these works by introducing it as an independent variable into the resulting model (Yau et al., 2021). This study fully confirmed the need for such developments to buy time for specialists and find more effective methods for treating breast cancer.
Conclusion
The study revealed that the null hypothesis about the 5-year mortality risk in 50% of the sample participants was confirmed, without grounds to accept an alternative hypothesis, based on Kaplan-Meier analysis and the constructed survival chart. The interpretation also included a similar graph by age group, with the results confirmed for each group. The discussion and comparison with the current work confirmed the result. They justified the need for further research, primarily in developing advanced methods for treating breast cancer. At the same time, approaches to survival estimates have not yet received significantly more effective methods, even with machine learning.
References
Győrffy, B. (2021). Survival analysis across the entire transcriptome identifies biomarkers with the highest prognostic power in breast cancer. Computational and Structural Biotechnology Journal, 19, 4101-4109.
Li, J., Zhou, Z., Dong, J., Fu, Y., Li, Y., Luan, Z., & Peng, X. (2021). Predicting breast cancer 5-year survival using machine learning: A systematic review. PloS One, 16(4).
Moncada-Torres, A., van Maaren, M. C., Hendriks, M. P., Siesling, S., & Geleijnse, G. (2021). Explainable machine learning can outperform Cox regression predictions and provide insights in breast cancer survival. Scientific Reports, 11(1).
World Health Organization. (2024). Breast cancer.
Yau, C., Osdoit, M., van der Noordaa, M., Shad, S., Wei, J., de Croze, D. & Symmans, W. F. (2022). Residual cancer burden after neoadjuvant chemotherapy and long-term survival outcomes in breast cancer: a multicentre pooled analysis of 5161 patients. The Lancet Oncology, 23(1), 149-160.
