Introduction
Most of the healthcare issues involve a series of transitions between several health states and the state’s probabilities. However, neither the influence diagrams nor decision diagrams used in these transitions provide a practical solution. The Markov models on the other hand are designed in such away that they efficiently represent recursive events, whether short term process like surgical procedure or long-term process like chronic disease management (Briggs and Sculpher 2000, p. 139).
Methods
There are two methods which can be effectively used to find the Markov model discrete value; cohort calculations (calculating expected values) and Monte Carlo (trials simulation). Cohort analysis is used to determine the expected value by multiplying the cohort percentage in a given state by a specified incremental value for the same state. The product is then summed up with others from all the states from every stage. The Monte Carlo trail simulation on the other hand determines the incremental values summation of the several states taken by an individual. A value assignment in the Markov model is often referred to as a reward be it a utility, cost or any other attribute. This can be represented by a root node cycle referred to as a Markov node. Each health state emanates from the main node, with a branch representing each state. (Hazen and Li 2010, p.25).
Markov Model
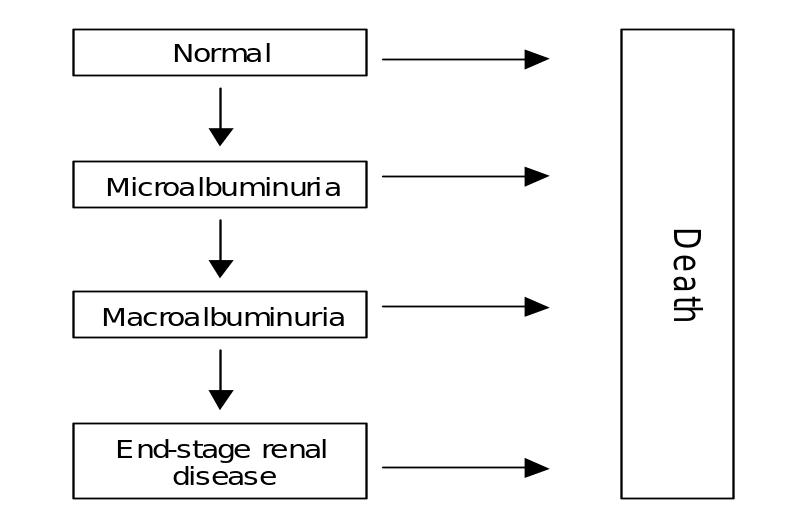
The states in the Markov model represent disease severity at different levels or any qualitative directions taken by the disease. A good example of this model is a Markov model of renal diseases that focuses on diabetes. In this case, the model focuses on renal compromise severity, that is, normal, macroalbuminuria, microalbuminuria, and renal disease at its end-stage
In this model, the progression risk has been expressed for every unit time, that is, per simulation cycle, in the node state. This implies patients with microalbuminuria have a 5% risk of moving to macroalbuminuria. The intervention effectiveness is in most cases taken as the progression risk reduction. An example of this in the diabetes state is the case where ACE-inhibitors reduce the progressing risk transition from microalbuminuria to macroalbuminuria by approximately 70%.
In this era of increasing demands and limited resources for healthcare spending, there is an increased pressure for treatments that are both cost effective and highly effective. The Markov model is recognized for achieving expected effectiveness, expected costs and cost-effectiveness. This is achieved by the automatic generation of reports and graphs which specify marginal and average values for effectiveness, costs and cost-effectiveness. The analysis of cost-effectiveness can also be achieved by Monte Carlo simulation or calculating the expected value. When it comes to the transition of complex states, the Markov model has to be determined using Monte Carlo trail simulation so as to evaluate the outcomes of individuals.
The analysis of cost-effectiveness (CEA) involves a number of methods used to evaluate decisions on the basis of two criteria. Such criteria make use of different scales outcomes. The analysis is mostly applicable in situations where the limitations of resources need balancinag so as to maximize its effectiveness and contain its costs as well. Both CEA and TreeAge Pro are used simultaneously to compare the expected effectives and expected costs values at any given node. Text reports and cost effectiveness graph are important tools in the analysis of cost-effectiveness using Markov models. The text reports and cost-effectiveness provide key information required in the interpretation of calculations on cost-effectiveness such as dominance existence and incremental values (Fink 2000, p. 56).
Reference List
Briggs, A. & Sculpher, M 1998, ‘An introduction to Markov modeling for economic evaluation’, Pharmacoeconomics, vol. 13, no. 4, pp.397-409.
Fink, G 2000, Markov Models for Pattern Recognition: From Theory to Application, Springer, New York.
Hazen, G. & Li, Z 2010, ‘Coherent decomposition for Markov cost-effectiveness models’, Medical Decision Making, vol. 31, no. 1, pp. 19-34.